How can we help?
Alerting
Alerting
zWAN alerts are divided into two categories based on their source:
Director Alerting
Director alerting features monitor the Director server, its services, and other components, notifying users and logging events to ELK when specific actions occur. These events are predefined during the Director server deployment and alerts are sent via email using the configured SMTP settings.
Below are the predefined director events:
- Node Status Changes: Alerts on node transitions (e.g., node down, node up).
- Service Status Changes: Alerts on microservice status changes (e.g., service down, service up, service restart).
- Backup Failures: Alerts when scheduled backups fail.
- Kubernetes Node Disk Pressure
- Persistence volume health down
- Server running out of disk space
Limitation:
- SMTP Configuration: SMTP configuration changes must be made using the deployment script; modifying SMTP settings through the UI does not apply to certain events. Future versions will address this limitation.
CPE Alerting
CPE alerting monitors device operations and sends email notifications for specific events.
- The alerting feature notifies you when data from one or more databases meet certain conditions.
- We support email as a notification channel for alerts.
- This advanced section is for users familiar with scripting and Linux fundamentals.
Key Terms
| Terms | Definitions |
|---|---|
| Monitor | A job that runs on a defined schedule and queries a database. |
| Trigger | Conditions that, if met, generate alerts. |
| Alert | An event associated with a trigger that performs actions like sending notifications. |
| Action | The information that the monitor sends when triggered. |
| Destination | A reusable location for an action, such as email, Slack, or a webhook URL. |
Predefined Alerts
Predefined monitors check for alerts every 5 minutes and send notifications once conditions are met.
- Autoflow – Generates an alert for network balancing rules.
- Net Balancer – Generates an alert for failover and gateway monitoring.
- IPS Alert – Detects network attacks like DDoS.
- IPS Flow – Tracks which server-client attack was detected.
- CPU and Memory Threshold – Alerts when CPU reaches 80% or higher and memory is under 500MB.
- Firmware Update – Alerts when a firmware update is successful.
- Interface Status – Alerts on LAN/WAN status changes.
- Reboot – Alerts when the device reboots.
- UnCleanShutDown – Alerts when the device shuts down unexpectedly.
- Startup – Alerts when the device starts successfully.
- Tunnel Status – Alerts on SSL/IPSEC tunnel creation or deletion.
- LTE – Alerts with signal quality details.
- DDOS Attack – Alerts for ICMP flood, port scan, SSH brute force, etc.
- DNS – Alerts for NXDOMAIN, REFUSED, and SERVFAIL errors.
Steps to Create Monitor for Predefined Alerting
- Go to the Alerting menu in the Provider UI.
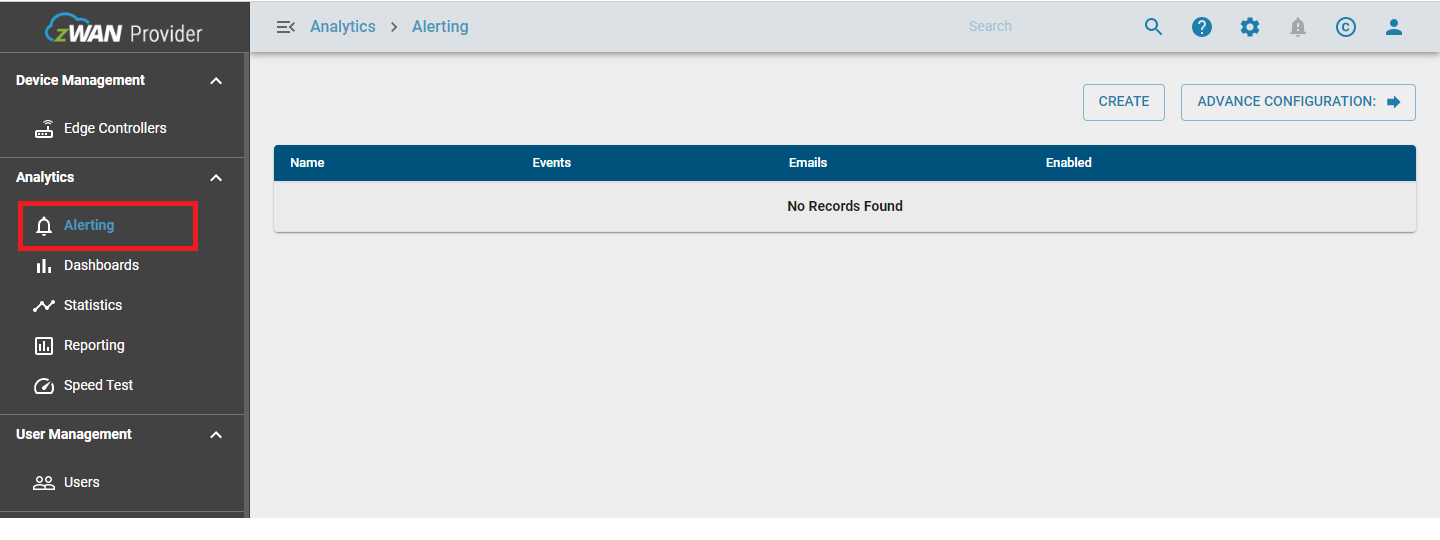
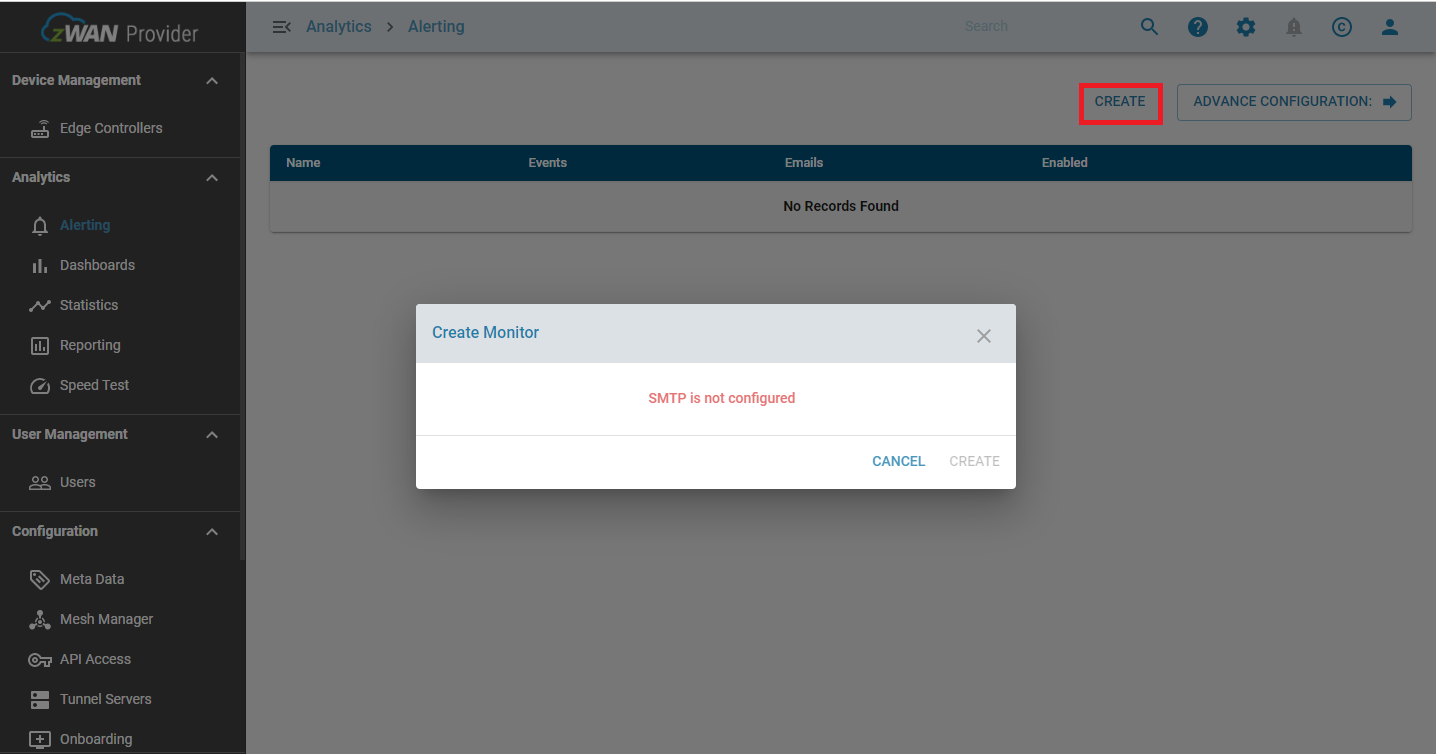
- SMTP credentials need to be configured when first creating alerts.
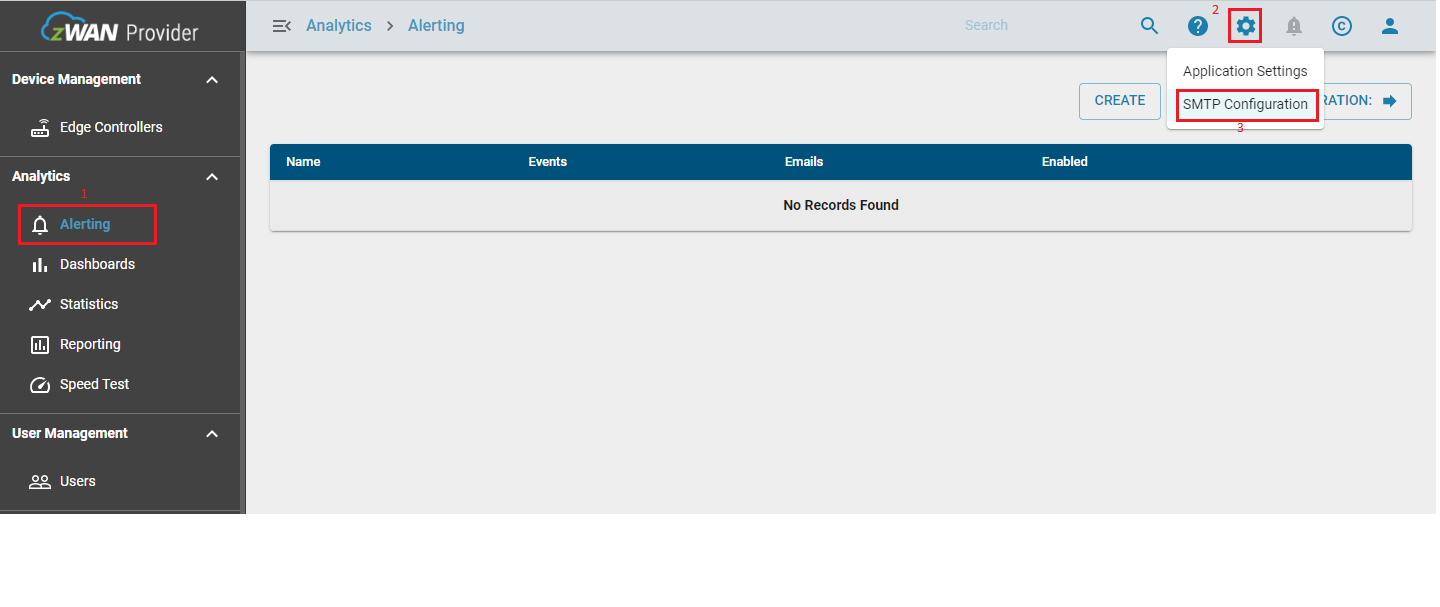
- Conifugre SMTP credentials.
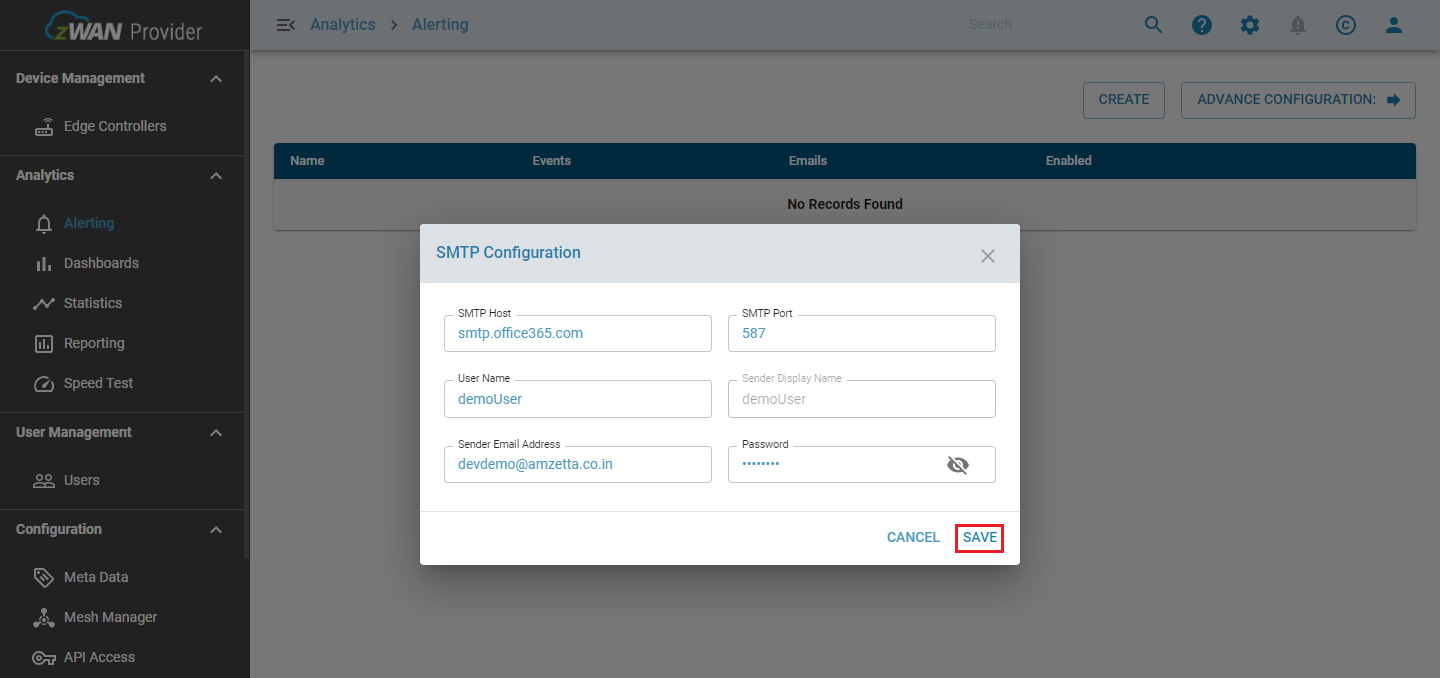
- Enter SMTP settings and save.
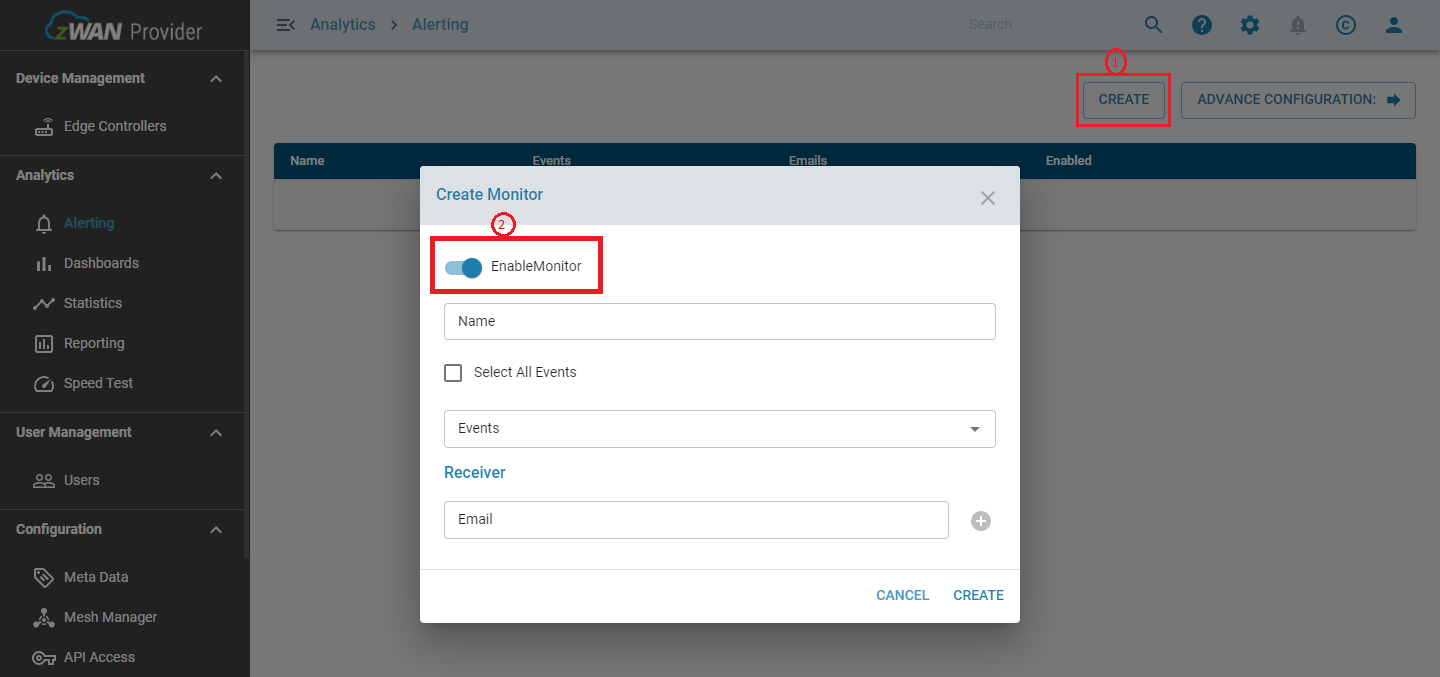
- Click CREATE to enable monitoring.
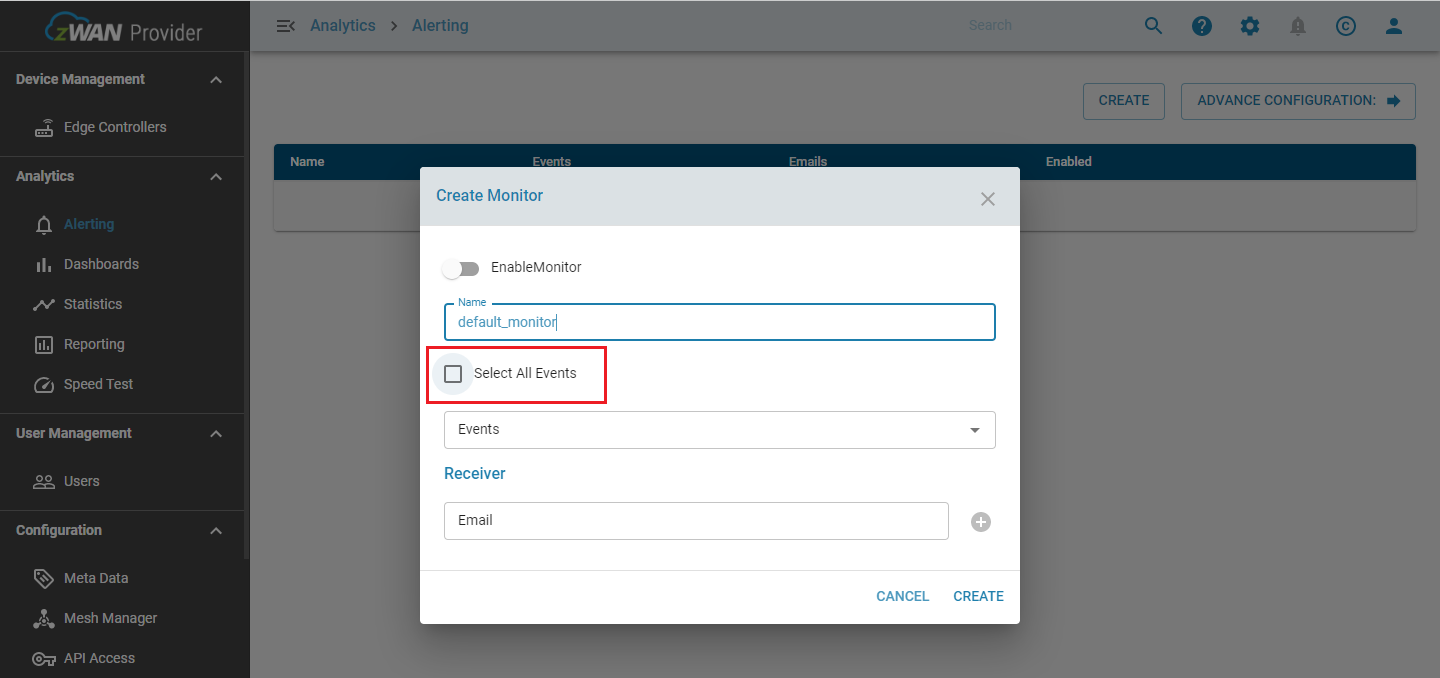
- Select events for monitoring.
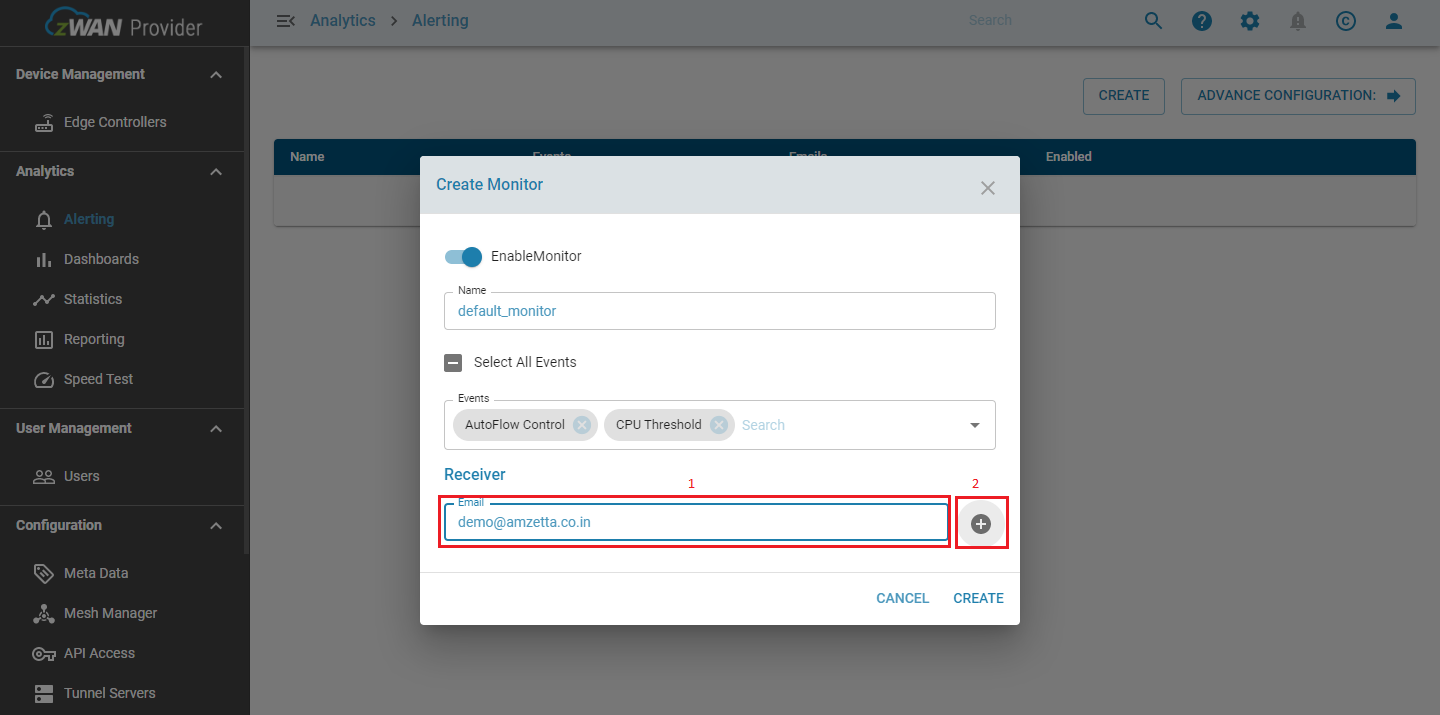
- Enter recipient email addresses.
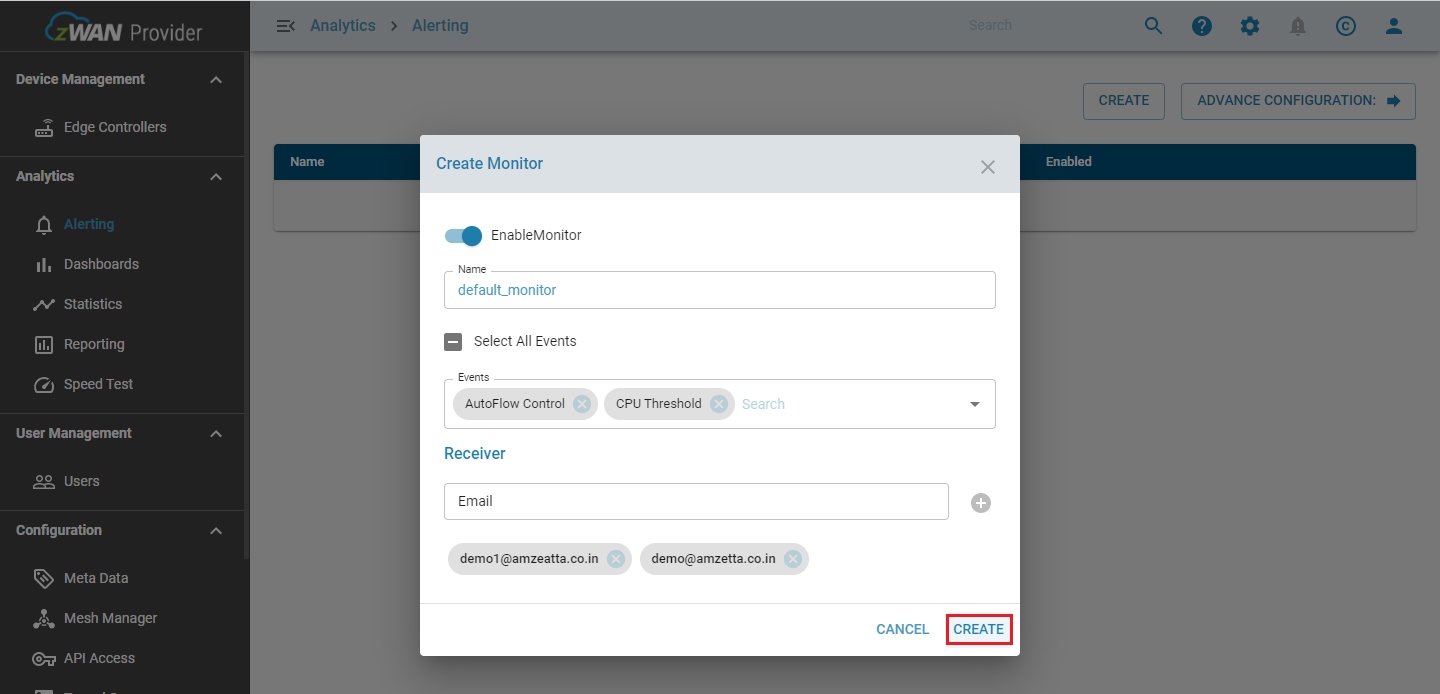
- Click CREATE to finalize the monitor.
Advanced Configuration
To change triggers:
- Go to Advanced Configuration -> Monitor.

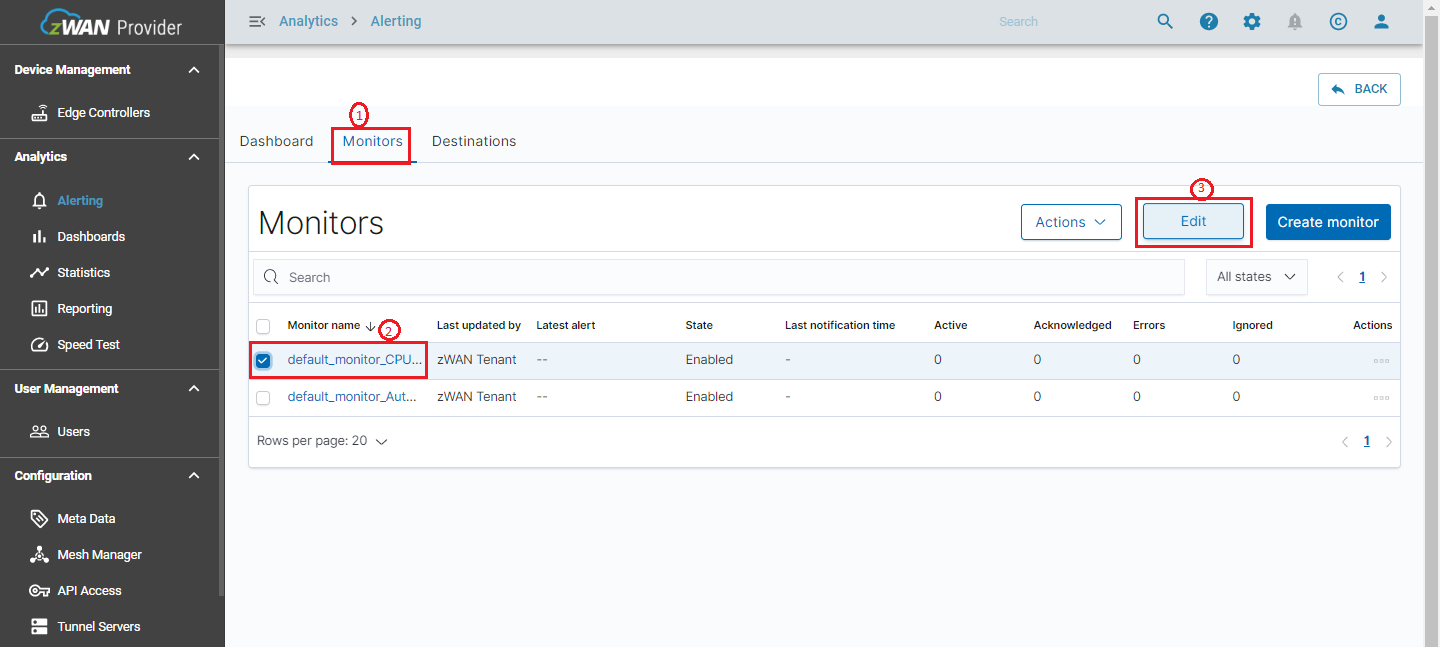
- Edit the trigger settings.
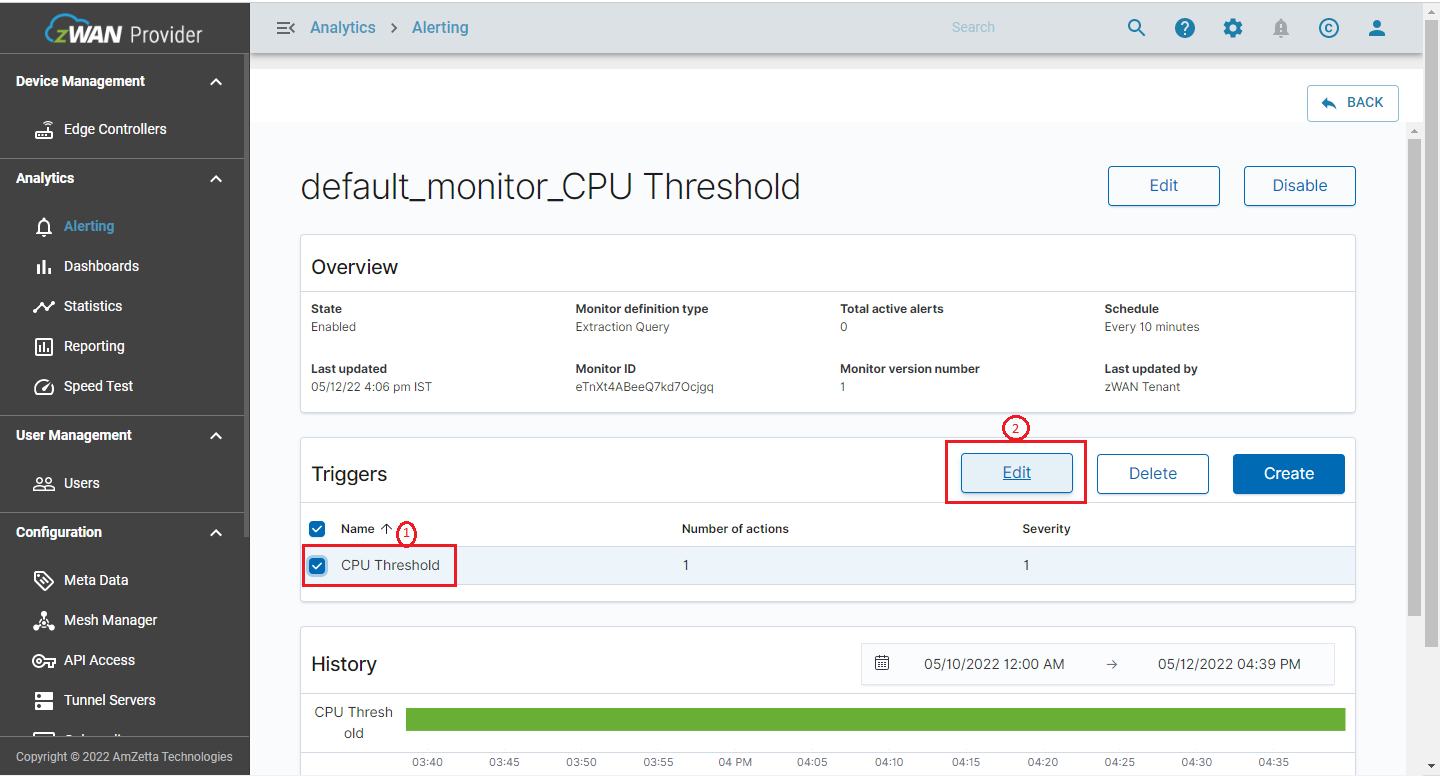
- The alerting feature notifies you when data from one or more database meets certain conditions. For example, you might want to notify in email if your application logs more than five HTTP 503 errors in one hour.
- We are supporting e-mail as a notification channel to send an alert.
- This advanced section is only for users who are familiar with scripting and Linux fundamentals.
Key Terms
| Terms | Definitions |
|---|---|
| Monitor | A job that runs on a defined schedule and queries database. The results of these queries are then used as input for one or more triggers. |
| Trigger | Conditions that, if met, generate alerts. |
| Alert | An event associated with a trigger. When an alert is created, the trigger performs actions, which can include sending a notification. |
| Action | The information that you want the monitor to send out after being triggered. Actions have a destination, a message subject, and a message body. |
| Destination | A reusable location for an action, such as Amazon Chime, Slack, or a webhook URL. |
Predefined Alerts
- Some categories of alerts are pre-defined for ease of use. A monitor is pre-created with defined trigger condition and an e-mail is sent to notify the user.
- Predefined monitors will monitor the alerts for every 15 minutes and will send an alert once the conditions are met.
- The notification in email contains following details like tenant name from which the notification is sent, device IP address or host name, and message.
- Autoflow – Defines a rule to generate an alert for network balancing rule for autoflow controller.
- Netbalancer – Defines a rule to generate an alert for failover monitor and gateway monitor. Netbalancer rule will contain jitter, latency and packet loss conditions.
- IPS Alert – Defines a rule to detect network attacks like DDoS
- IPS Flow – Defines a rule to generate an alert as to which server to client the attack was detected.
- CPU and Memory Threshold – Defines a rule when CPU and memory met certain condition. It generates the alert when CPU utilization reaches 80% or above and free memory is less than 500 MBs.
- Firmware Update – Defines a rule when the device is updated with latest firmware image successfully.
- Interface status – Defines a rule when the device interface status is changed, like LAN or WAN is UP or Down.
- Reboot – Defines a rule to alert the user whenever the device reboots.
- UnCleanShutDown – Defines a rule to generate the alert whenever the device was shutdown unexpectedly following the last power cycle.
- StartUp – Defines a rule to generate an alert when the device started successfully.
- Tunnel Status – Defines a rule to generate an alert whenever the SSL/IPSEC tunnel created or deleted. Tunnel is an medium to communicate between the sender and receiver.
- LTE – Defines a rule to generate an alert with signal quality details like signal to noise ratio, signal strength and the interface name with LTE support.
Steps to configure alerts
- Create destination as e-mail.
- Create sender and receiver group in e-mail destination. Configure sender details in keystore file and load the database.
- Create monitor to monitor the scheduled job and mention the period of monitoring.
- Create trigger which contains some conditions.
- Create action which contains the information that you want the monitor to send out after being triggered. Actions have a destination, subject, and a body.
Configuration
Create destination
- Navigate to Alerting –> Destinations –> Add destination.
- Specify a name for the destination so that you can identify it later.
- Select e-mail type as destination and choose Add sender >> New sender >> enter a unique name. Enter the e-mail address, SMTP host and the port.
- Choose an encryption method, or use the default value of none. However, most email providers require SSL or TLS, which requires a username and password in keystore file. In our case we are using TLS as encryption method and port as 587.
- Choose Save to save the configuration.
- Choose Manage e-mail groups >> Add email group >> New email group >> Enter a unique name >> Save. For recipient e-mails, enter any number of e-mail addresses.
- Click Create button to create a destination.
Steps to configure SMTP sender details in keystore file
Modify keystore database to add the user/e-mail credentials, if you have selected TLS or SSL in the previous step.
- Login to provider with admin permission.
- Login ELK VM with admin permission using SSH client like Putty.
- Steps to login to ELK VM, enter password when promted:
sh $ ssh router@ELK $ sudo su - OR in single server deployment, use the following commands:
sh $ cd /root/VMELK $ vagrant ssh $ sudo su
- Steps to login to ELK VM, enter password when promted:
- Login to odfe-node docker container as admin user:
sh $ docker exec -u 0 -it odfe-node /bin/bash - Follow the below steps to configure username and password
- The is the name you entered for Sender earlier.
- Set username using below command:
sh $ ./bin/elasticsearch-keystore add opendistro.alerting.destination.email.<sender_name>.username - Enter the sender username
- Set password using below command:
sh $ ./bin/elasticsearch-keystore add opendistro.alerting.destination.email.<sender_name>.password - Enter the sender password.
- Exit from the container using below command
sh $ exit
- To update user’s credential, call the reload API update those credentials using below command.
sh $ curl -XPOST -k -u <admin_username_from_provider>:<admin_password_from_provider> "https://127.0.0.1:9200/_nodes/reload_secure_settings"
Note:
- You can reuse senders across many different destinations, but each destination only supports one sender.
- Keystore settings are node-specific. You must run these commands on each node and need to reload all the nodes.
Create monitors
- Navigate to Alerting -> Monitors -> Create monitor.
- Specify a name for the monitor. Choose one or more indices. You can also use * as a wildcard to specify an index pattern.
- Choose “Define using visual graph”. Then choose an aggregation (for example, count() or average()), a set of documents, and a timeframe. Visual definition works well for most monitors.
- Advance users familiar with DSL queries can go with using
Extraction Query as a monitor type. - Choose a frequency and timezone for your monitor. Note that you can only pick a timezone if you choose Daily, Weekly, Monthly, or custom cron expression for frequency.
- Choose Create.
Note:
- Define the monitor in one of two ways either using visual graphs or using extraction query.
- We are using an DSL query for predefined alert categories.
Create triggers
- These steps differ based on whether you chose “Define using visual graph” or “Define using extraction query” or “Define using Anomaly detector” when you created the monitor.
- Specify a name and severity level for the trigger. For Trigger condition, specify a threshold for the aggregation and timeframe you chose earlier, such as “is below 1,000” or “is exactly 10 or ”is above 500”.
- We can configure multiple triggers for one monitor.
- Add an action and specify a name for the action. Choose a destination which was created under “Destination” tab.
- Add a subject and body for the message.
- Change the mustache templates, for example:
{"text":"Monitor {{ctx.monitor.name}} just entered alert status. Please investigate the issue.
- Trigger: {{ctx.trigger.name}}
- Severity: {{ctx.trigger.severity}}
- Period start: {{ctx.periodStart}}
- Period end: {{ctx.periodEnd}}"} - Choose Create.
Note:
- You can add variables to your messages using Mustache templates.
- (Optional) Use action throttling to limit the number of notifications you receive within a given span of time.