IPFIX
Overview
Monitoring, analyzing and taking corrective/preventive action is a very important feature in any innovative, centrally managed, critical data-savvy technical solution. zWAN is no different in that aspect. Critical and time sensitive data flows through zWAN edge controllers once configured, and any failure, disruption, downtime or data loss can result in loss of business, monitory loss and chaos in today’s networking world. Time and data is valued more than anything. An efficient networking solution should be able to monitor, collect, analyze, report and auto correct itself. To enable that monitoring tools are needed, which we will detail further here.
IPFIX
ZWAN edge controller supports IPFIX protocol version 9. It collects all the forward traffic to/from LAN/WAN and exports to the IPFIX collector running at ZWAN Provider node. The IPFIX module handles sending the flow, TWAMP results, and event logs to the configured reporting or collecting server. The collecting server can then be used to create user friendly visualizations in any reporting server services such as Prometheus, ELK etc…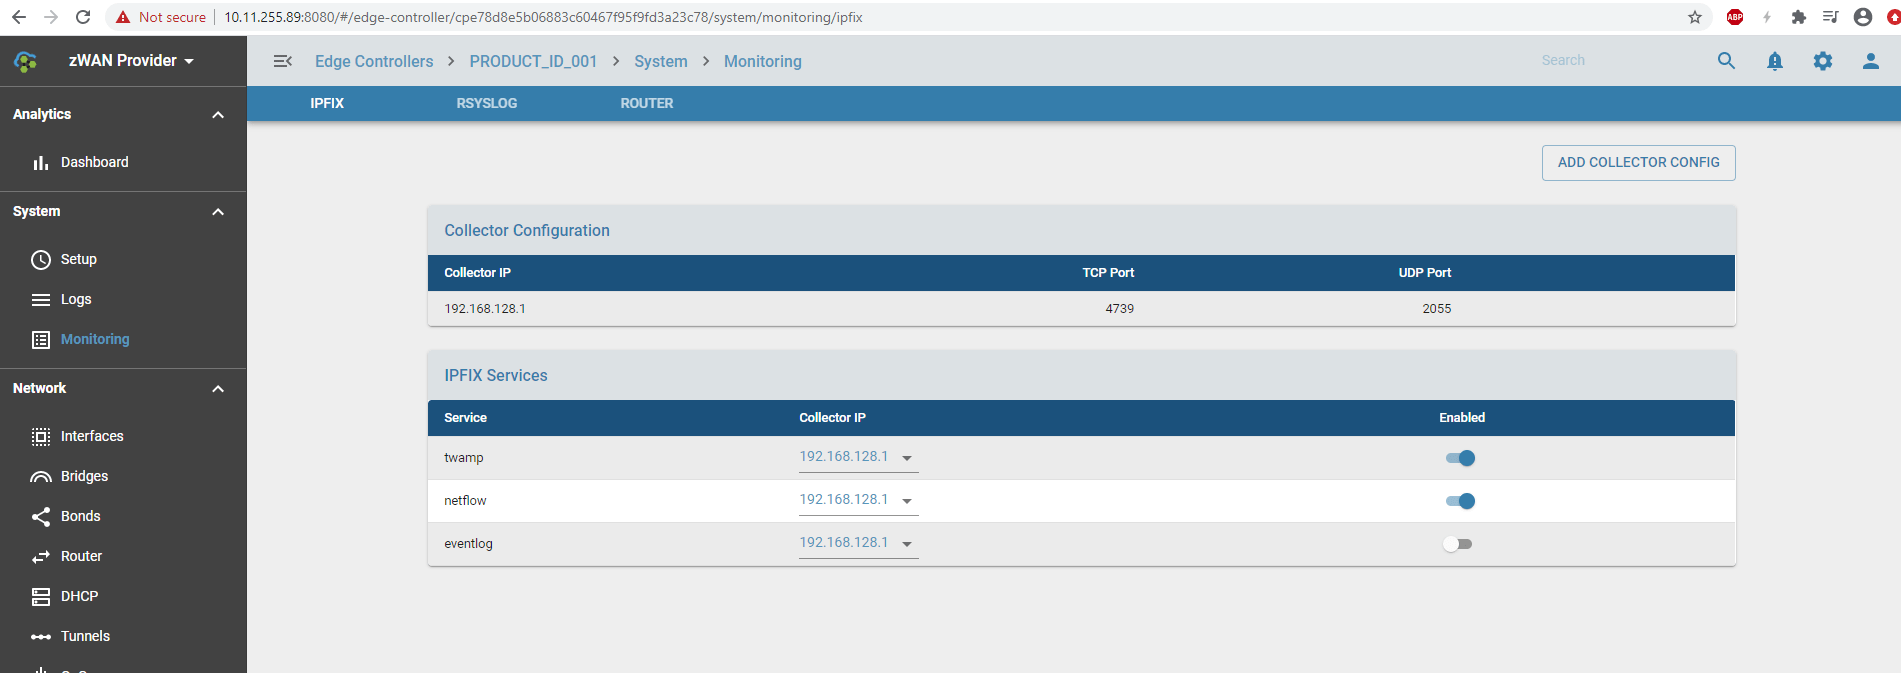
Functionality
Collector
The collector is the reporting server to which the IPFIX data is forwarded. It is the task of the collector to collect the data, save, manipulate and visualize it in a user friendly view. One such collector supported in zWAN SDWAN solution is an ELK server. The collector can be configured by adding collector config options. The parameters used to configure the collector are: Collector IP, UDP port, TCP port, or both UDP and TCP ports. Enabled option is used to enable or disable sending data to the configured collector. The TCP or UDP port number depends on which of the collectors is configured to receive the forwarded data from all edge controllers.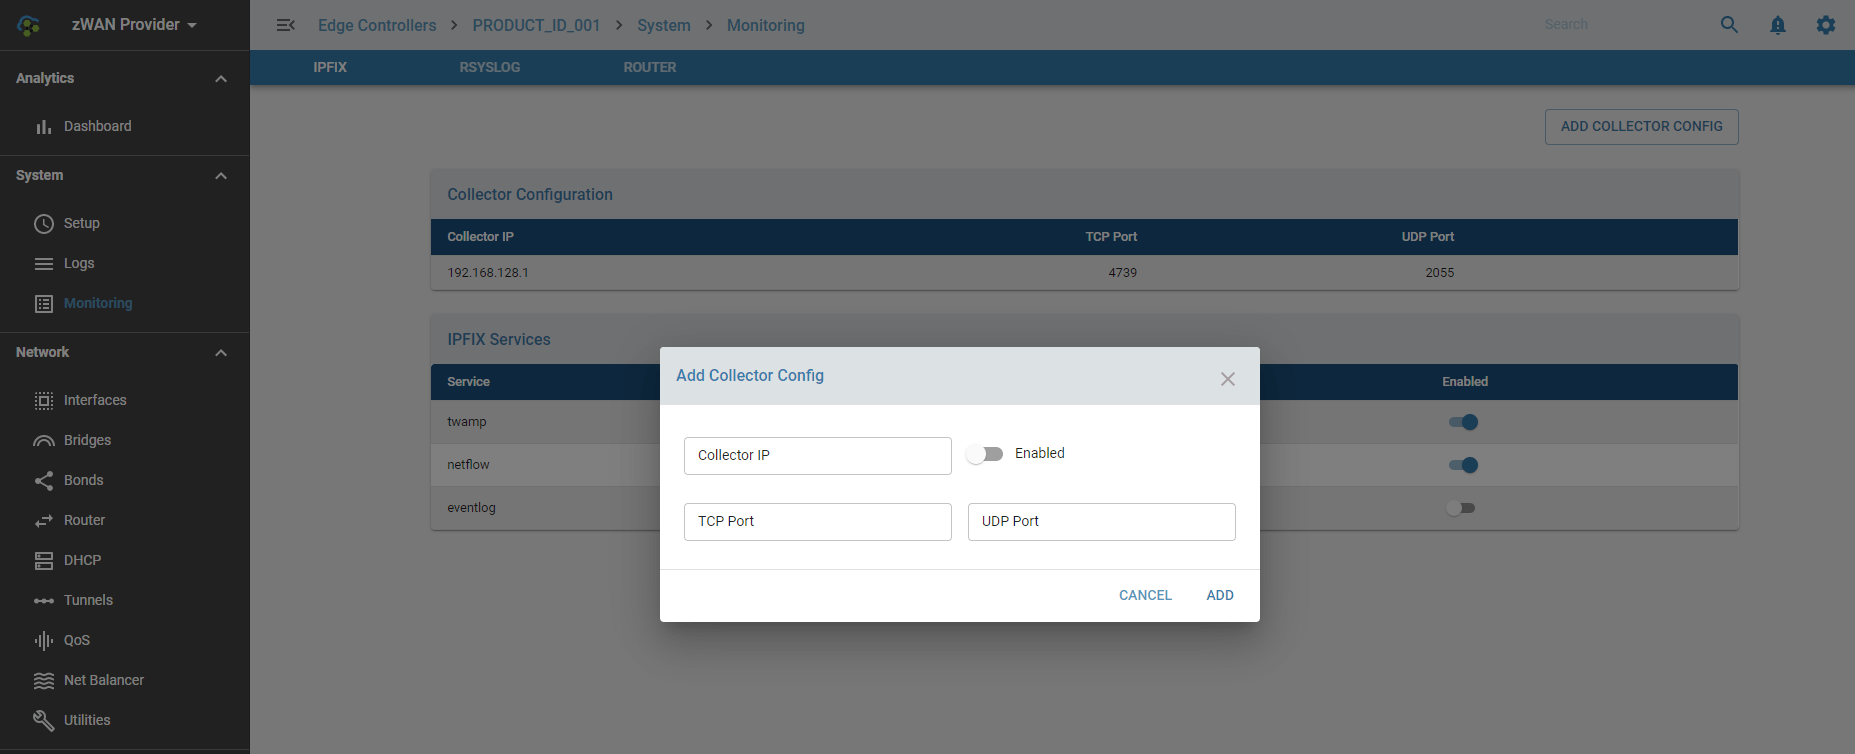
Services
The services sections allows the administrator to decide what kind of data to be forwarded to the collector server. The user can enable or disable the service from sending the data to the desired collector IP. The configurable options for services are to enter the destination collector IP, then the particular service data should be forwarded. TWAMP service uses UDP port to send the TWAMP sender performance test session results to the collector IP. The user can configure multiple collectors, and the service can select the desired collector to configure the service in IPFIX. Another important service which is supported is netflow. This is a critical service which logs and reports the flow data to the reporting server.
Result
Once the IPFIX services are configured to forward the data to the collecting server such as ELK, the user can verify the same in Kibana.
Future Enhancements
Eventlog is currently not supported. The support will be added in future releases.