-
SnapOS
-
-
- Articles coming soon
-
-
-
- Citrix HDX + USB Headset (Call-Center Baseline)
- OS/Firmware Update & Rollback
- Power Management and Session State
- Wi-Fi Roaming & Link Change Mid-Session
- Kiosk / Assigned-Access Auto-Launch
- Barcode Scanner (HID) with Line-of-Business App
- Printing to Local USB & Network Printers
- USB Device Management – Block Storage
- Multi-Monitor & 4K Performance
- Microsoft AVD/RDP + Teams Optimized Video
- VMware Horizon + Smart Card / CAC Login
-
-
-
-
zWAN
-
-
-
-
- Firewall & Layer 7 Application Filtering
- VPN Site-to-Site Tunnel Setup & Connectivity (z40 to Cloud vGR)
- Intrusion Prevention System (IPS) / Intrusion Detection System (IDS) Testing
- DNS Filtering
- DDoS Protection & Logging
- MAC Address Filtering & Geo-fencing
- Application Control & Protocol Blocking
- Authentication & Access Control (zID)
-
- WAN Link Failover & Load Balancing (ACI Mode)
- Dynamic Path Selection & Application-Aware Routing
- SaaS & Internet Breakout Validation
- QoS for Microsoft Teams (Datacenter vGR + Branch z40)
- Tunnel Failover (z40 ↔ vGR) — WAN00 (wired) primary, WAN03 (4G) & WAN04 (5G) backups
- IP Routing & Static Route Steering (z40 Branch)
- VLAN & Layer-2 Bridging
-
-
-
-
-
-
- Articles coming soon
-
-
-
-
- Articles coming soon
-
- Articles coming soon
-
-
-
-
-
-
- Articles coming soon
-
- Articles coming soon
-
- Articles coming soon
-
- Articles coming soon
-
-
-
-
-
- Articles coming soon
-
- Articles coming soon
-
- Articles coming soon
-
- Articles coming soon
-
-
-
-
-
- Articles coming soon
-
- Articles coming soon
-
- Articles coming soon
-
- Articles coming soon
-
-
- Articles coming soon
-
- IPsec Tunnel not Establishing
- SSL-VPN Tunnel not Establishing
- Mobile Network Issues
- Management Tunnel does not Establish
- DNS not Resolving from Local Network Appliance
- DNS Resolution Issues in Tunnel Configuration
- DHCP Server not Leasing IP to LAN PC
- Debugging EC Events - Unknown Status Issue
- Trusted-MAC Geofencing Issues
- DNS Issues from DC LAN PC
- Troubleshooting LAN Connectivity to Internet via WAN, Remote Branch LAN, or Local Branch LAN
- NetBalancer gateways displaying Faulty/Inactive
- Packet Drop Issues
-
-
zAccess
-
StorTrends
Dashboard
Overview
The Dashboard View provides administrators with a centralized overview of the current zMan Director environment including device status, zDM status, zDM onboard status, assigned zDM-zTC relationships, firmware information, task activity, firmware update status, and configured profiles.
This page is designed to provide a quick operational snapshot of the overall deployment environment.
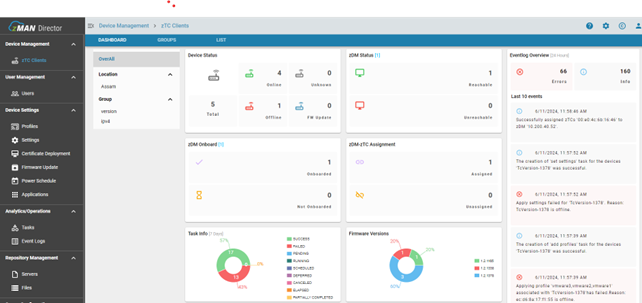
Dashboard Sections
The dashboard contains multiple operational widgets and informational panels that provide visibility into the current environment.
Typical dashboard areas include:
- Device Status
- zDM Status
- zDM Onboard Status
- zDM-zTC Assignment Status
- Event Log Overview
- Task Information
- Firmware Version Distribution
- Registered Device Counts

Device Status
The Device Status panel displays the number of:
- Online devices
- Offline devices
- Total registered devices
- Devices currently undergoing firmware updates
This allows administrators to quickly identify operational issues across the deployment.
zDM Status
The zDM Status section displays the connectivity and operational status of deployed zDM servers.
Administrators can identify:
- Reachable zDM servers
- Unreachable zDM servers
- Current onboarding state
Event Log Overview
The dashboard provides a summarized Event Log Overview panel displaying recent operational activity and system events.
This may include:
- Task failures
- Firmware deployment activity
- Device registration activity
- Configuration deployment status
Firmware Visibility
The dashboard may also display firmware version distribution information across registered zTC endpoints.
This helps administrators:
- identify outdated firmware versions
- monitor upgrade adoption
- verify deployment consistency
Operational Monitoring
Dashboard View is intended to provide centralized operational visibility for:
- MSP deployments
- Enterprise environments
- Multi-site endpoint management
- Thin client onboarding operations
- Firmware rollout monitoring
Notes
- Dashboard statistics may refresh periodically.
- Visible widgets may vary depending on user permissions.
- Offline devices may continue to appear until heartbeat timeout thresholds are reached.
- Dashboard visibility depends on active zDM communication.